Solid State Coffee
Café on the Upper West Side, founded in 2021.
Summary:
Long wait times often turned people away from visiting Solid State Coffee due to a bottleneck at the register. Through consumer interviews, 5 out of 10 people stated they do not visit Solid State on the weekend due to the long wait times. A contextual inquiry revealed three main reasons for the register bottleneck:
An overtasked register workstation
Consumer menu questions at the register
Confusion on where to pick up orders required the register employee to answer questions after a transaction
Initial Planning:
My initial thoughts at the beginning of this project were prompted by the bar manager, who is a friend, telling me, “If you have any thoughts on how we can improve, let me know. We are pretty limited in what we can do, because of finances and space, though.” This project started out as something I could do to help my friend, then ended with an official contract with the company. Their main question was: Are we losing customers because the wait is too long? If so, how can we reduce wait times?
On the surface, there was always a line out the door, and yet some of the employees felt there was nothing they could do to help with the rush, depending on their tasks. So my assessment started with three main questions:
How long is the wait during peak hours?
How long do people feel like the wait is? (This is arguably more important!)
What in the throughput design is contributing to this bottleneck the most?
Wait Time Data:
I figured I would start with some quantitative data, just to understand where the problem stands. My initial idea was to utilize the camera system and consider using subject tracking technology to gain huge amounts of wait time data. Upon looking into it, the owner expressed that the cameras were down, so I had to pivot to a more crude data collection method: utilizing secret shoppers to come in during peak hours and time their waits.
Secret shoppers weren’t ideal, but the data did give us a rough estimate of wait times. This data then helped inform my questiosn for a qualitative analysis with customers in the area.
Here is the data captured from the secret shoppers:
Weekend Averages: 13 minutes and 37 seconds
Weekday Average: 8 minutes and 13 seconds

For this analysis, I used Google Sheets to compile the times recorded, sorted by days of the week. I would have liked to have done an hour-by-hour breakdown or even surveyed for multiple months to get more robust data; however, time and money were constraints, so getting some general estimates was good enough to move on toward qualitative analysis.
1 on 1 Interviews:
I began thinking about interviews, and who it was important to ask about the wait times. Sampling from the cafe meant asking people who obviously didn’t think the wait was too long to not come into the cafe. Though, asking random people on the street meant probably running into an issue of talking to a lot of people who are not in the market for specialty coffee. My solution was to sample from people at/around other coffee shops in the neighborhood and sample a few from Solid State Coffee. This, I was hoping, would neutralize the bias, as no doubt some people might be biased toward their coffee shop of choice.
The results centered around similar sentiments as the research question: Wait times were the primary factor in deciding where to go for coffee.
With 5 out 10 participants claiming they never go to Solid State Coffee due to the waits, and all of the participants mentioning they often went elsewhere over the weekend due to the wait times.
Contextual Inquiry:
So, with the wait times estimated and the interview data finished, I moved to the contextual inquiry portion, with the main goal of observing operational inefficiencies and attempting to isolate the most important ones that pertain to reducing wait times.
I watched during service as a customer for several days, had the bar manager give me a behind-the-bar tour, and even worked a few shifts to better understand the flow of the design and the hiccups in the process.
After this, I spoke with some employees and shift leads, asking them their thoughts on some of the aspects I began to suspect were holding up service efficiencies.
Through contextual inquiry, I found a bottleneck at the register and consumer confusion around product pickup. The main issues were:
Too many pick-up points
An overloaded register workstation
Inconsistent instructional prompts/signs to guide consumers

Over the course of this study, I found two main categories of design challenges. Here are the challenges along with the opportunities that may reduce wait times and/or improve consumer retention:
Optimize Bar Flow
Reduce register tasks
Their primary task should be to answer customer questions, take consumer orders, and move people along as quickly as possible.Create a single product delivery point
This would allow one workstation on the bar to always provide drink delivery at a single point to customers, which will make for an easier transfer of goods because the customer’s expectation of where the items ordered will be received will be consistent.Start delivery training
To reduce customer questions and confusion, coach the delivery person to say something like, “Here is your food. When you are finished, we have a bus bin near the kitchen window on the way out, if you would just drop off the dishes there. My name is ____ and if you have any further questions you can find me at the counter.”
2. Engage the Consumer Earlier
Create an earlier first contact
Something that has been proven to reduce consumers’ line anxiety is an earlier point of first contact, wait time estimates, and purchasing products earlier in the waiting experience.Consider a second register outside
Having a handheld register that meets customers in the line and sends orders through, specifically coffee orders, might greatly reduce wait times and alleviate a large portion of the line.Consider free samples in line
Passing out samples in the line can be a good way to reduce line anxiety, as occupied time feels shorter than unoccupied time.
After writing out this report, I presented the link to the café owner and bar manager. They opened the page, said, “Oh wow, okay I’ll look at it later,” then weeks went by and one of them said, “Yeah, I really want to dig into this, but it is really long. I’m sure it’s good though!”
So, I came back to it, was honest with myself, and decided I needed to make it shorter and clearer! I then wrote this reformatted report with clearer deliverables and an impact statement as the first line.
I sent an email with the new link, telling them I had reformatted the report, and the owner emailed back within two days to negotiate a contract to help them redesign the bar flow.
My Biggest Learning:
I realized I had a lot of great findings in the first version, but it was ultimately irrelevant to the stakeholders. Reformatting and shortening the report to better suit what they want to know was crucial to getting my research seen and acted upon.
Contract for Redesign:
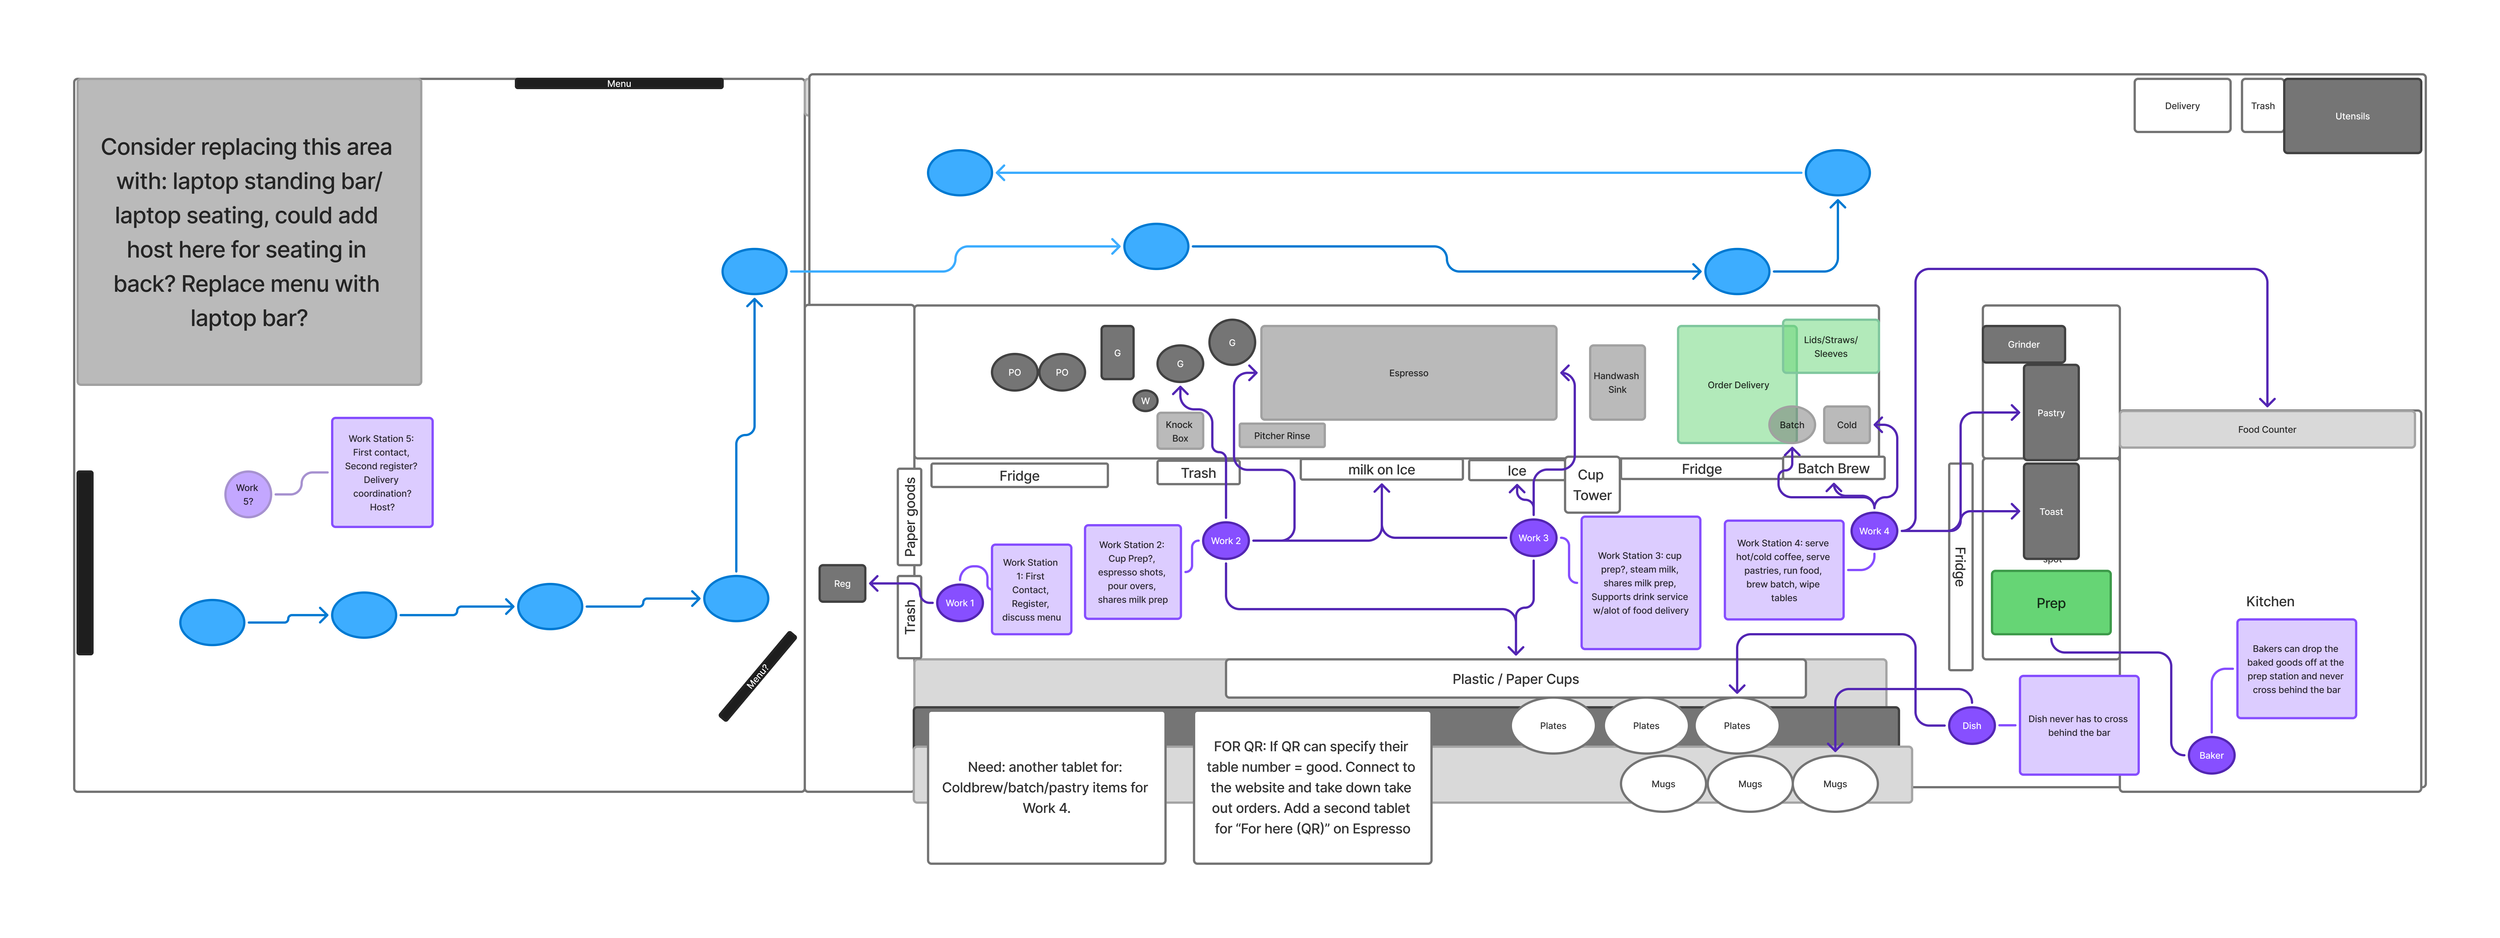
They agreed to start working on the redesign and recruited my help for new design iterations based on the research. In line with my recommendation for a second register/additional entry point for consumer orders, the owner began working on integrating QR ordering from the table.
My task then was to build a service design around a new QR ordering system and rework each workstation’s tasks based on the contextual inquiry research. This also meant figuring out any additional technology integrations in order to better adopt the QR system.
We also looked at other operational inefficiencies slowing down service, such as restocking plates and pastries. We then found some ways to reduce work stoppage for those activities.
Some limitations we needed to consider were expenses, as the owner wanted to prioritize reorganizing tasks and looking into adding staff rather than investing in new equipment.
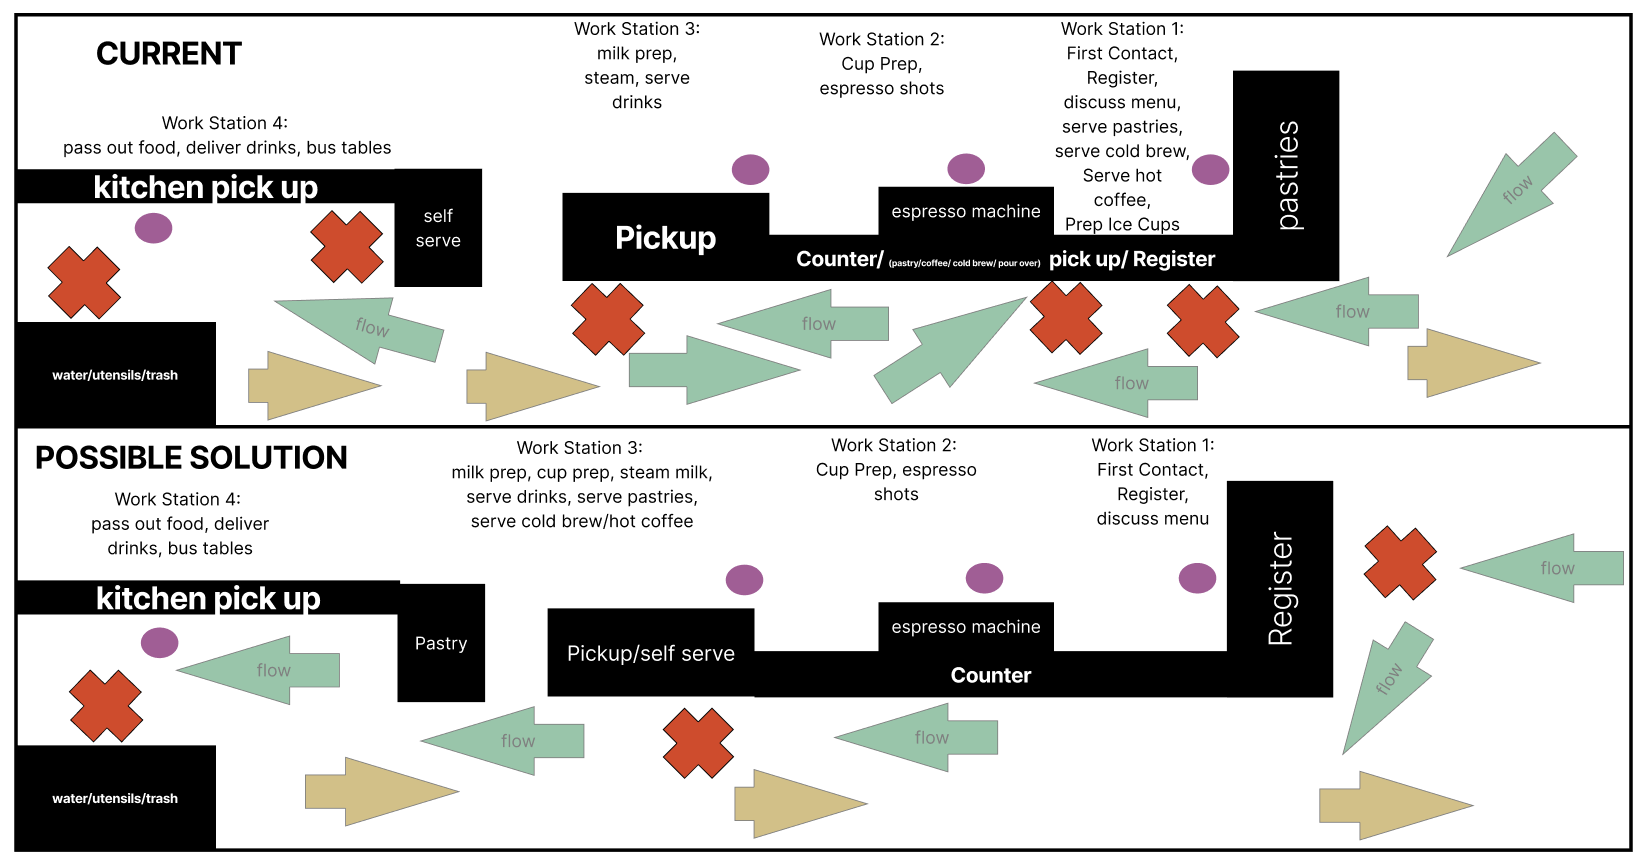
Below are some of my mock-ups of the space and redesign options.
All of the design choices were made in collaboration with the baristas, back-of-house, the pastry chef, and bar manager, utilizing the research as guiding principles for what should change. These insights and recommendations were then presented to the owner. The shop is now in the process of integrating changes.
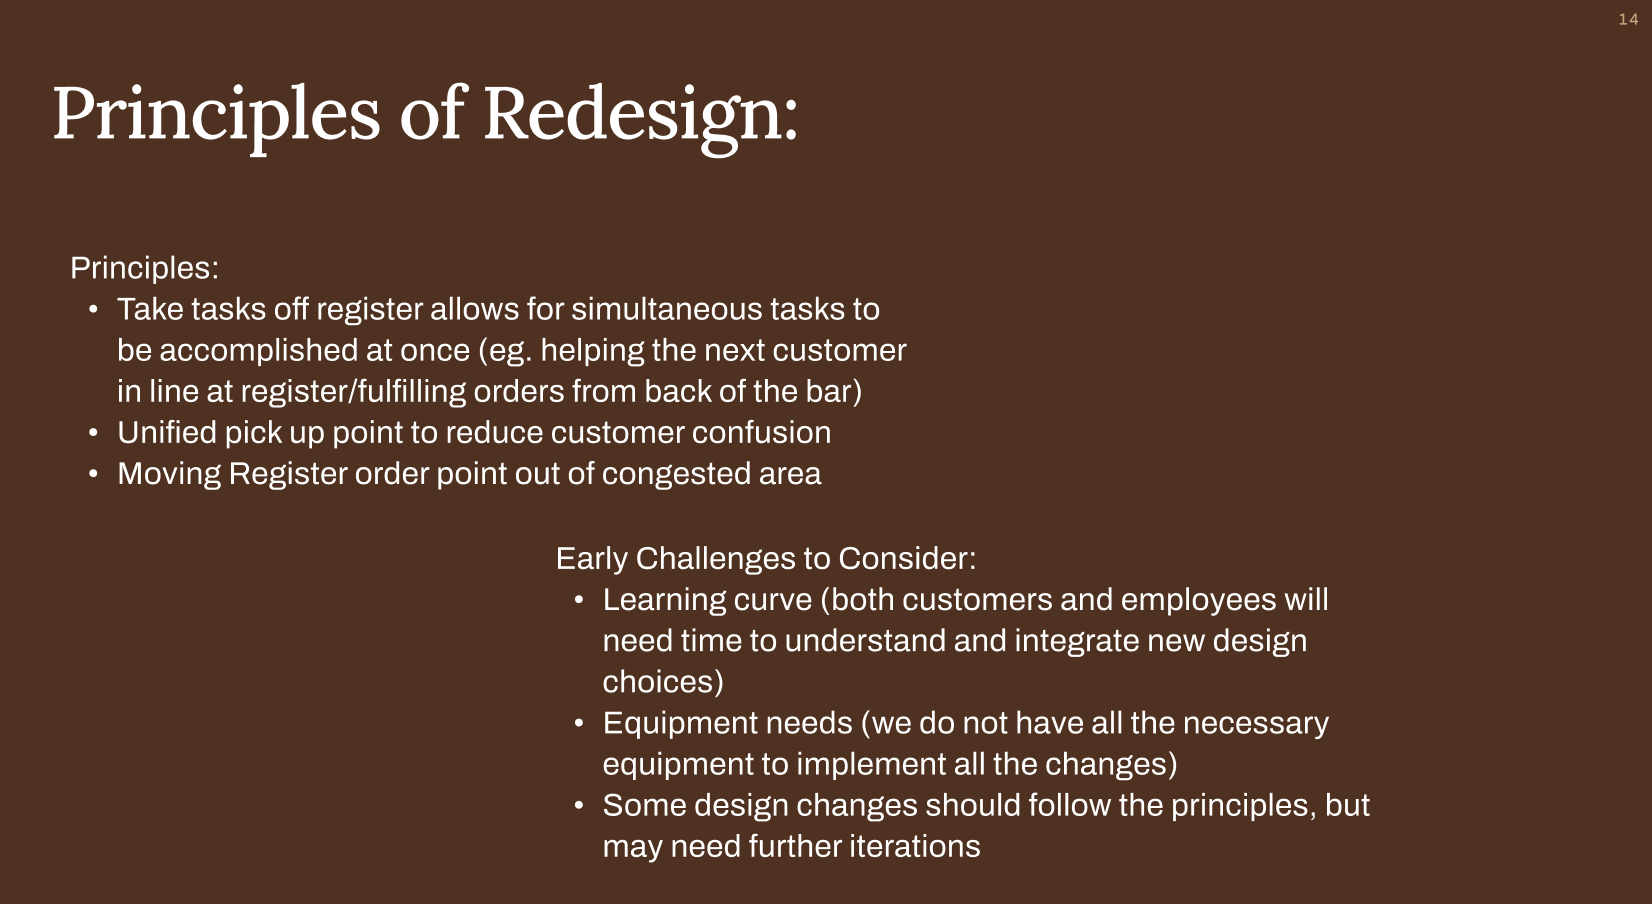
I wrote out some of the most essential principles for the design changes based on the research, then passed these ideas on for them to use as guideposts for future design iterations, when challenges come up in the future.
All of the design choices were made in collaboration with the baristas, back of house, the pastry chef, and bar manager utilizing the research as guiding principles for what should change. These insights and recommendations were then presented to the owner and the shop is in the process of integrating changes now.
Impact of the research:
Through my work, the café was able to start new initiatives that better prioritized workflow efficiencies, and de-prioritized initiatives that were not in line with the research findings.
Improved the focus of the team, and even had unity among baristas and back-of-house employees about necessary changes for greater workplace efficiency.
Imparted quantitative data metrics for them to look at in the future - particularly, orders taken per hour during the busiest hours to calculate efficiency, rather than just sales numbers.