Solid State Coffee
Café on the Upper West Side, founded in 2021.
A look at the consumer experience and the impact of design on wait times. Using contextual inquiry and individual interviews, a qualitative look into the data.
Executive Summary
Background and Objective
        
Solid State Coffee is a small coffee shop on the Upper West Side. My objective was to find:
How long is the wait time?
Observe and look for possible service inefficiencies that may contribute to longer wait times
Through interviews, find consumer perceptions about wait times at Solid State Coffee
Methods
I utilized contextual inquiry and individual interviews to track wait times, analyze workflow inefficiencies, and find the general perception of the wait times from neighborhood coffee shop regulars.
Participants
I recruited several volunteers to stand in line to order drinks and track wait times on each day of the week.
Another group of participants were people in the Upper West Side who drink coffee on a regular basis, and who have heard of Solid State Coffee.
Findings
Average wait times during the week were just over 8 minutes, while weekend wait times ballooned to nearly 14 minutes. This led to conversations about Solid State Coffee’s identity, and questioning how long consumers were willing to wait for food service versus coffee. 
Inefficiencies in the workflow were present, particularly in the distribution of tasks across the employee workstations. Through the contextual inquiry, a bottleneck of tasks appeared present in the register workstation, while other workstations were idle, or near idle.
Finally, consumer perspectives showed a lot of hesitation to visit Solid State Coffee on the weekend, and even during the week, due to the long lines that are often present.
Background
Setting
Solid State is a small, locally owned coffee shop on the Upper West Side, a neighborhood in Manhattan, NY. They are known for serving great coffee, as they source and roast the coffee themselves, and for having a great pastry chef on staff who makes pastries fresh everyday as well as driving their full kitchen food menu. The food menu is stacked with upgraded versions of standard items such as breakfast plates, salmon toasts, and beet yogurt bowls made with fresh ingredients. They are an open seating café and have 16 tables, with some additional bar seating in a back room and some outdoor seating. 
Problem
There is often a line to the register at Solid State. This extended line tends to cap the number of consumers they can help during peak hours. The owner suspected the perception of extended wait times to be the primary reason people leave the line or turn away before coming into the shop. 
Past Research
In the initial research on the psychology of consumer lines, the idea that people’s service experience is shaped by wait times was validated in a study conducted by American Customer Satisfaction Index who found that wait time duration was one of the primary drivers of customer satisfaction.
A study by Wangoo Lee and Lu Lu at Temple University found that the presence of a line reduced consumer order time, reduced the amounts of money spent and often resulted in the ordering of familiar menu items. This finding is not poor in itself, but further pushes this idea, consumers might be less willing to spend more with longer lines.
And finally, a research article titled “The Psychology of Queuing” written by Adrian Furnham, Luke Treglown, and George Horne had a lot of influence on my perspective as a researcher throughout this project. This study found a correlation between consumers willingness to wait increases for more valuable services. There was also correlations with time estimations for wait times extending the willingness to wait longer and over estimating wait times helped to improve perception of service. An additional point of emphasis in this study, which I was curious to track with Solid State Coffee, was that there was more willingness for consumers to wait after placing an order than before placing an order.
Research Goals
Research Questions
How long is the wait time?
Are there identifiable points in service process that slow down order taking?
What are consumer perceptions of the wait times?
Research Objective
I felt this was important to better understand and quantify the problem. With the willingness to wait statistics, I wanted to track the total wait time, as well as the wait time to the register and after placing the order.
My intention here was to figure out if the service design was impacting the wait times and to what degree if possible.
The main idea behind this question is to determine whether consumer habits in the neighborhood are influenced by wait times. Not just if there is a long wait, but how do they respond to that wait.
Methods
Contextual Inquiry
Individual Interviews
Wait Times
I first checked with the owner of Solid State Coffee to see if I was able to access the camera system to track consumers through the line. This, I felt would have been the most efficient way to track average times, and even better would be utilizing subject tracking technology to quantify large amounts of line data at once. However, the camera system was down. The budget for the project was limited and did not include the ability to invest in new technology. Instead, I recruited several participants to stand in line in exchange for free coffee. They would start the timer upon entering the back of the line and would make a note of how long it took for them to reach the register and for first contact, they would then track the time until they received their drinks. I recruited 10 people to come in on different days and varying times, all clustered around 9am-noon, noted as the busiest times of day. This sampling took place over a month-long period to try to account for busier weeks versus slower weeks. After having volunteers time their wait 60 times, I stopped collecting data. I felt 60 was sufficient to get a sense of the average wait times, given the method of collecting data I utilized. If I could do it again, I think a more efficient method would be to utilize contextual inquiry for more time, or to recruit an additional researcher to track consumers through the line. Computer systems or camera systems would be much better positioned for these times, too, if access to technology was available.
Workflows
In order to analyze the workflow of the bar, I decided that contextual inquiry would be the best approach. This would allow for observation to occur over the course of several days and allow for me to monitor workflows with varying levels of consumer volumes in the shop. For the contextual inquiry, no participants were recruited from the customer base, but I did recruit the help of the bar manager, the lead barista, and several of the barista staff for interviews after the observation portion was completed. I brought with me several notepads, pens and a computer for tracking data points.
Consumer Perceptions of Wait Times
For the individual interviews, I took some interviews from consumers inside Solid State Coffee, but I also wanted to know about the perception from the community surrounding the shop, too. So I set up shop and asked people in other coffee shops as well to get information from coffee shop goers about their general ideas about coffee in the neighborhood, as I felt people in other shops would have a higher chance of being people who live generally nearby and who drink coffee. For the interviews, we talked to 10 people total, who all stated they drank coffee at least twice a week, lived nearby, and had heard of Solid State or had been there before. Out of the 10 interviewed, 5 customers were sourced from inside Solid State who confirmed they live nearby. I offered to buy all of their coffee if they agreed to answer a few questions about coffee in the neighborhood. I felt this was important in order to answer the third research question about consumer perspective on the wait times, and wanted to elicit responses from people who perhaps do not choose Solid State as their coffee shop of choice, as they might be more willing to give criticism of a shop they do not frequent as often.
Findings and 
Recommendations
Wait Times
Analyzing the chart below, the average total wait time at Solid State Coffee was 9 minutes and 45 seconds, but this does not tell the whole story, as there were two distinct sets of data in the analysis. The first set was the weekday data, minus Friday, and the second set was the weekend data plus Friday (Friday is a weekend day, right?). Separating these two sets, we had an average total time of 8 minutes and 13 seconds during the week, with the highest wait time during the week being 8 minutes and 17 seconds. The weekends were much longer, with average total wait times being 13 minutes and 37 seconds, with the longest wait time recorded being 17 minutes and 37 seconds. Drink delivery held fairly consistent, with weekdays being an average of 3 minutes and 15 seconds, while weekends were 5 minutes 15 seconds. This two-minute difference is a decent amount of variance; however, looking at the day-to-day numbers, Monday through Friday average drink times were all under 3 minutes and 40 seconds, and Saturday and Sunday had roughly a 6-minute and roughly a 5-minute wait, respectively. An additional observation was that the wait times were longer before the order was put in, and the drink delivery times were shorter; this was counterintuitive to the research done prior to the study, which indicated consumers were more willing to wait after placing their order.
Workflows
In my time conducting the contextual inquiry, I had three main themes in the observations that stood out regarding the workflow. Included in the chart below are what I observed of the actual consumer flow, as well as the workstations and their assigned tasks on the top, and the bottom chart is a general recommendation of how the design might be better streamlined.
Theme 1: Station Bottlenecks
For the employee stations, these stations were more or less effective in assigning expectations; however, each station was not equally divided in their tasks, with the one register station being responsible for all of the following tasks: order taking, pastry delivery, serving drip coffee, tea brewing, cold brew delivery, pour over making and espresso cup setup. Other stations were: 2. Espresso shot pulling (all just one station), and then 3. drink steaming, drink calling, and in-house drink and food delivery (to the table). On weekends, there is an additional 4th station for food and drink delivery. This presented a bottleneck in the service experience as the register station was often performing many tasks, and the other stations were often held up by the speed of the register station, which frequently meant the register station was performing 2 or 3 tasks while the other stations waited. Not all the orders taken would even yield an espresso drink either, with many orders consisting of food, drip coffee, cold brew, and/or just pastries. This meant the register person would often help 2 or 3 people, and perform 4-6 tasks before other stations would be needed.
Theme 2: Consumer Confusion
Another observation during the contextual inquiry was consumer confusion in the ordering portion of interactions. Throughout the observation, I noticed employees needed to guide consumers through the café design, where to pick up drinks, where to drop off their dishes, where to get straws and lids for their ordered drinks, and where the menu was while ordering at the cash register. This led to the staff making about 6-8 directive or informational statements to consumers while performing other tasks, and staff members mentioned it as one of the more annoying factors of their job. Although they reported these statements did not directly impact service times, employees mentioned it as a factor in slowing down their ability to focus on service, and the consistent pauses to address customer questions or address customers wrongly guessed the answers greatly affected their mood. From my observations, consumer confusion did contribute to congestion in the service area.
Theme 3: Café Identity
During the interviews with the staff, one topic of discussion was that a 10-15 minute wait to order at a food establishment, like a popular bagel spot or at Chipotle, would not be unreasonable on the weekend; however, a 10-15 minute wait for coffee is a fairly long time. This brought up questions the bar manager and lead barista had about the identity of Solid State Coffee: Are they a café, or are they a coffee shop?
This was then further reflected in their barista training, in which not much attention was spent on discussing food drop-off or pick-up with the baristas. When discussing training, drop-off procedures, and coffee delivery with the manager, there was no uniform method for drop-off, and no scripts were utilized for uniformity among staff members. This was also further confusing due to the variety of procedures used by baristas to manage drink delivery depending on their level of staffing, with drink running getting cut if they were short-staffed on a given day.
This tended to contribute to consumer confusion, as regular customers would more often ask where they should expect their drink, and casual customers more often expressed confusion that during previous visits their drinks were delivered to the table.
Bringing up some of the wait time data with the employees, the bar manager suggested that one of the longest portions of consumer interactions at the register was the food orders. Food orders bring in more money than the coffee orders, but do tend to take longer to communicate. Some register data suggested food sales increased dramatically over the weekends, and this would elongate the wait times greatly. This further confirmed the idea of a second register or a coffee-only register, in order to streamline coffee service while still maintaining the food menu.
The major themes of the interviews around the neighborhood echoed similar sentiments to the research questions: 1. The quality of the product was high, 2. Despite the high-quality product, the predominant factor when considering whether to go to Solid State Coffee versus another coffee shop was the wait times.
In my interviews with coffee customers around the neighborhood, Solid State was consistently rated highly among the best latte, best cold brew, best espresso on the Upper West Side; however, the long wait times were often discussed in conjunction with the quality. One participant on the sidewalk told me, “They have great espresso, but standing in the long line always takes forever. Sometimes I do not have the time to stand there before work. I would go more often if I knew it would not take so long.”
Another concern was with the space, with one mother mentioning, “I always have my stroller with me, and the congestion of the physical space means the stroller will make the space more cramped. So I am never sure if I can go, given that it’s often so busy.”
Finally, another participant commented, “On the weekend, I avoid Solid State completely, because the line is always so long.” After completing the interviews, 7 of the 10 interview participants mentioned the product quality, and it felt obvious that the consumers in the neighborhood all highly regarded Solid State’s product. The issue was with lagging wait times, as 5 of the 10 mentioned they hesitated to visit during the week, and especially hesitated, or even refused to go on weekends. With this strong opinion, having a soft launch of some of the new systems, having a few sample studies to test new wait times, and using that in an ad campaign or a social media campaign might help to change perspectives on potential wait times for weekend service.
Interview Insights
Closing Thoughts 
and Opportunities
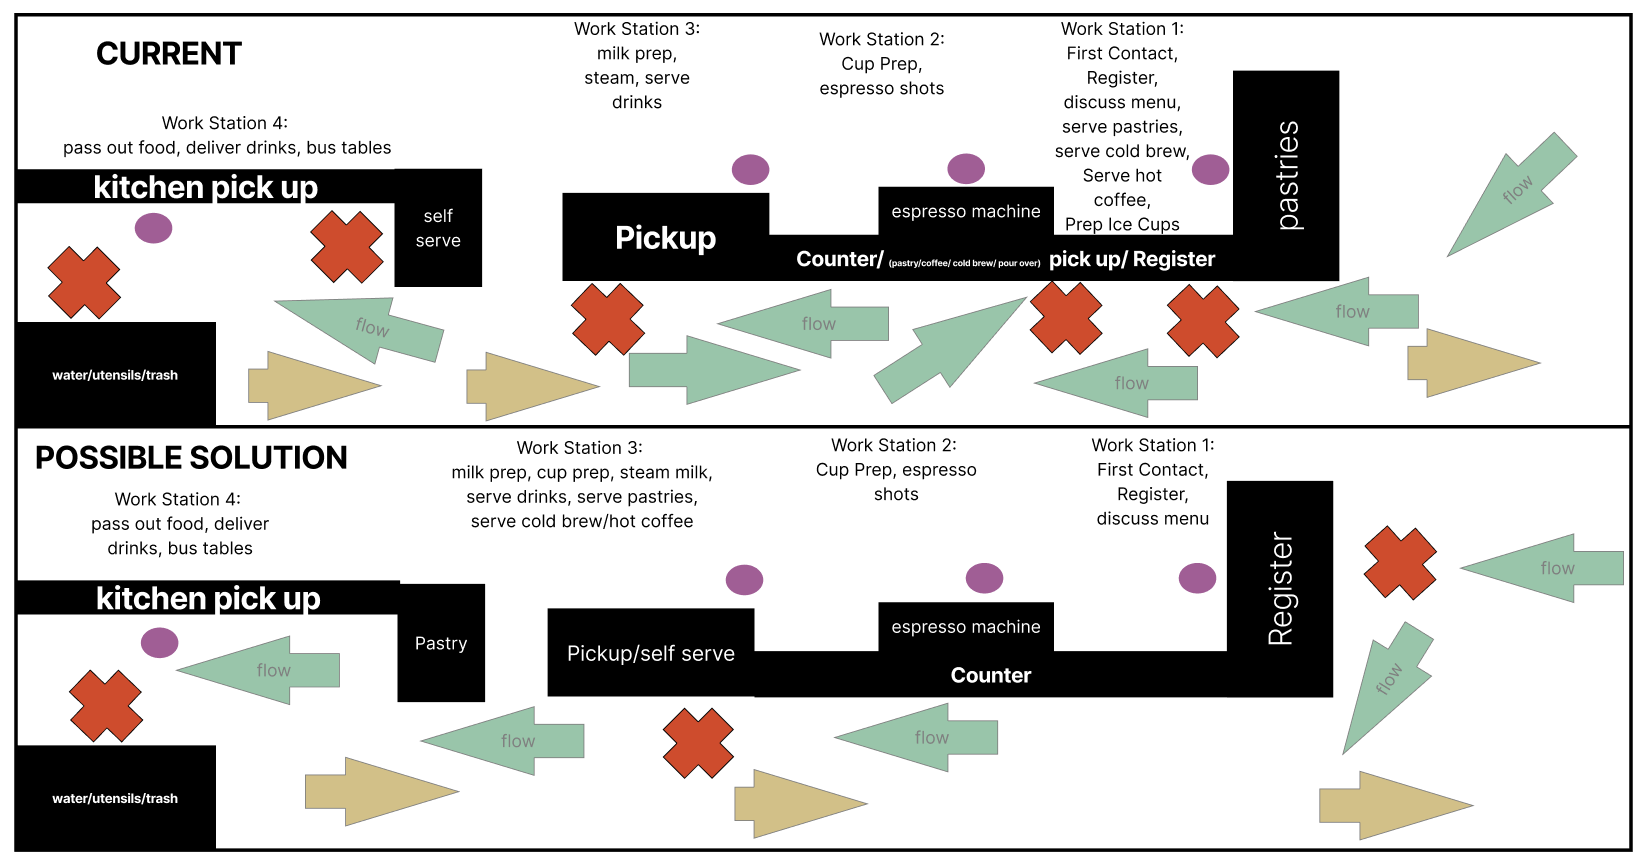
Over the course of this study, I found two main categories of design challenges. Here are the challenges along with the opportunities which may reduce wait times and/or improve consumer retention:
Optimizing the Bar Flow
Engaging the Customer Earlier in Line
Here are tactical opportunities for each category:
1. Optimizing the Bar Flow
Reduce register tasks
Their primary task should be to answer customer questions, take consumer orders and move people along as quickly as possible.Create a single product delivery point
This would allow one workstation on the bar to always provide drink delivery at a single point to customers, which will make for an easier transfer of goods because the customer’s expectation of where the items ordered will be received will be consistent.Start delivery training
To reduce customer questions and confusion, coach the delivery person to say something like, “Here is your food. When you are finished, we have a bus bin near the kitchen window on the way out, if you would just drop off the dishes there. My name is ____ and if you have any further questions you can find me at the counter.”
2. Engaging the Customer Earlier in Line
Create an earlier first contact
Something that has been proven to reduce consumer’s line anxiety is an earlier point of first contact, wait time estimates and purchasing products earlier in the waiting experience.Consider a second register outside
Having a handheld register and meeting customers in the line and sending orders through, specifically coffee orders, might greatly reduce wait times and might greatly alleviate a large portion of the line.Consider free samples in line
Passing out samples in the line can be a good way to reduce line anxiety, as occupied time feels shorter than unoccupied time.
Next Steps
Unanswered Questions
Based on the above opportunities, here are the next steps I recommend prioritizing:
Consider an earlier first contact
Consider a second register
Reassign tasks from the register to the other workstations
Wait time data variation throughout different times of year?
Solid State consumer habits change from summer to winter due to the consumers ordering more cold or hot drinks. Another changing habit is how frequently they come to solid state and how long they stay. It would be interesting to see if wait times change over the course of the winter.
Consumers may be less likely to travel by foot a lot less in the winter, and are much less willing to wait in a line outside in the cold.
Consumers might be more willing to stay and eat food through the winter months.
Workflows also change with the shift from cold drinks to hot drinks, as steaming milk takes more time than scooping ice into the cup. Workstation distribution would be important to reassess in the winter.
Do levels of crowdedness affect consumer likelihood to order more food or coffee?
Sources
Influential articles in my research:
https://www.scirp.org/journal/paperinformation?paperid=99238#ref40
https://waitwhile.com/blog/consumer-survey-waiting-in-line-2023/
https://www.psu.edu/news/health-and-human-development/story/wait-lines-may-boost-perceived-popularity-restaurant-brands
https://queue-it.com/blog/psychology-of-queuing/
https://modernrestaurantmanagement.com/why-setting-wait-time-expectations-is-key-to-a-good-customer-experience/
https://www.cafesuccesshub.com/why-the-wait-queue/